
The Organization Statistics page in MSPControl provides a high-level usage summary for the selected organization. It is designed to help administrators quickly understand how many objects and services are currently associated with the organization, how those totals compare against allowed limits, and how the tenant is structured across major categories such as users, groups, service levels, Remote Desktop resources, and Office 365 resources.
This page is especially useful for capacity review, tenant health checks, licensing visibility, and general administrative validation. Instead of opening multiple separate menus to estimate organization size, administrators can use this page as a consolidated statistics dashboard for the selected organization.
The Organization Statistics page is structured as a set of collapsible sections. Each section focuses on a different statistics group, allowing administrators to review the overall tenant composition in an organized way. The page combines basic organization identity information with usage counters and category-specific totals.
Most counters are shown in a format such as X of Unlimited, followed by a breakdown like (X in the Organization, 0 in others). This format helps administrators understand both the current quantity and the distribution context for the selected tenant.
Because this page is centered on statistical visibility rather than direct configuration, it is primarily used for review, planning, and administrative oversight.
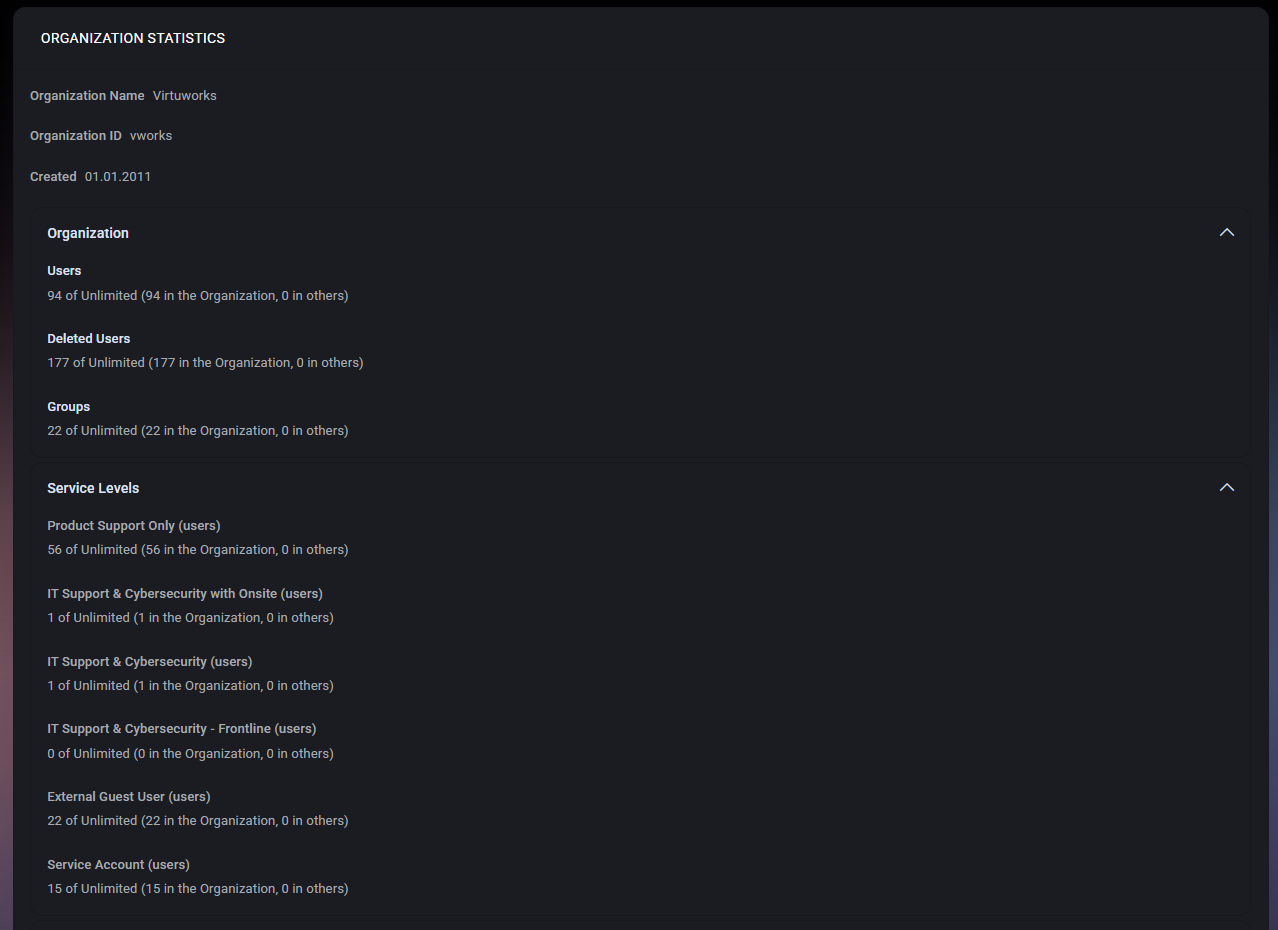
At the top of the page, MSPControl displays the key identity details for the selected organization.
These values help confirm that administrators are reviewing statistics for the correct organization before interpreting the counts shown further down the page.
The Organization section summarizes the core object counts for the tenant.
This section is useful for quickly understanding the size of the tenant from a core identity perspective. It gives administrators an immediate snapshot of how many user and group objects currently exist, while also showing how much deleted-user history remains stored for the organization.
The included breakdown text, such as in the Organization and in others, can help clarify where the counted objects belong when the environment contains broader shared or cross-organizational context.
The Service Levels section shows how users are distributed across the different service levels configured for the organization.
In the example shown, the statistics include entries such as:
Each item shows the number of users currently assigned to that service level, compared against the available limit, along with the same organization-versus-others breakdown used elsewhere on the page.
This section is valuable for operational reporting, service segmentation, and entitlement tracking. It helps administrators understand how the tenant population is distributed across support models or account types, which can be especially useful for service planning, licensing interpretation, and internal reporting.
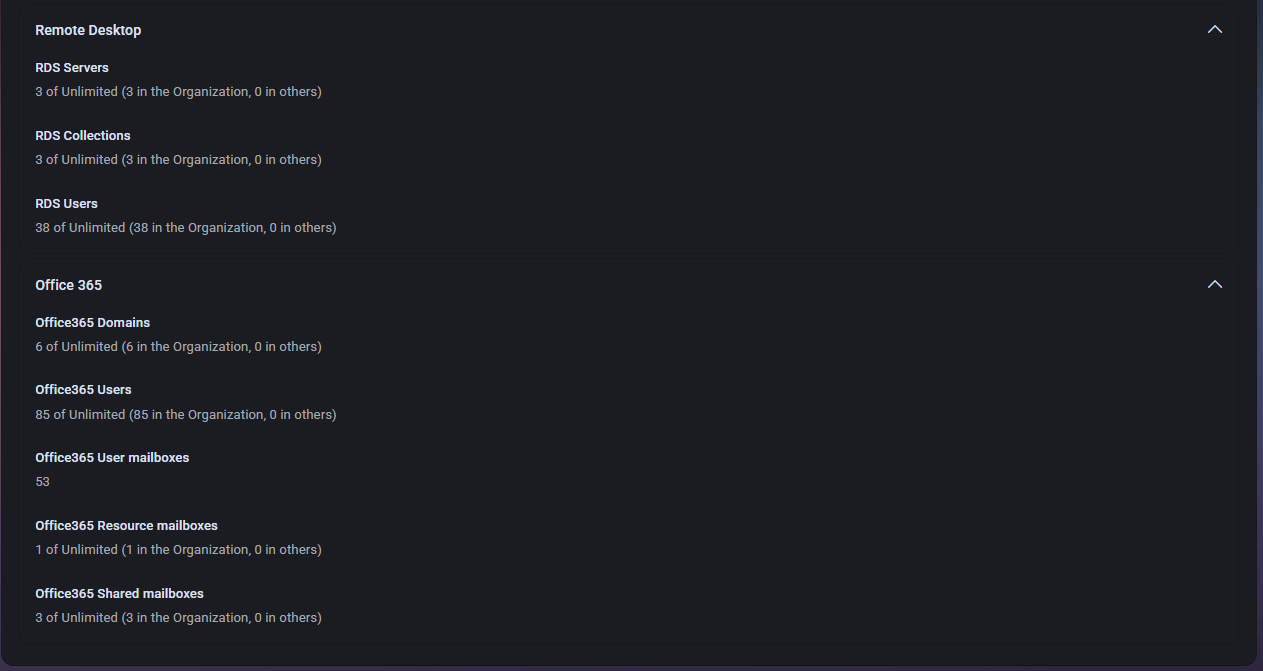
The Remote Desktop section provides usage statistics related to RDS resources.
This section is useful for understanding the scale of Remote Desktop usage inside the tenant. It helps administrators confirm whether the expected RDS infrastructure is present and how many users are connected to that environment from a statistics perspective.
For organizations that rely on published desktops or applications through RDS, this section offers a quick way to review Remote Desktop footprint without opening the individual RDS management pages.
The Office 365 section provides statistics related to Microsoft 365 or Office 365 resources connected to the organization.
This section helps administrators quickly review the Microsoft 365 footprint of the tenant. It is particularly useful when validating migration status, checking resource distribution, or confirming the approximate scale of mailbox usage without opening each mail-related page individually.
The difference between user, resource, and shared mailbox totals also helps provide a more complete view of how the organization uses its Microsoft 365 messaging environment.
Many values on this page follow a consistent display pattern such as 94 of Unlimited or 3 of Unlimited. This indicates the current count compared to the configured limit. When the limit is shown as Unlimited, the page is effectively communicating that no numerical cap is being enforced for that specific category in the current tenant context.
The additional text in parentheses, such as (94 in the Organization, 0 in others), provides more context about distribution. This can be useful when the MSPControl environment supports broader organizational separation or when administrators need to confirm that the counted objects belong only to the expected tenant.
No credit card required for free, limited license.