
The Azure Dashboard page in MSPControl gives administrators a summarized view of Azure consumption for the current hosted organization. It is designed to make Azure cost tracking easier by combining filters, report actions, and visual widgets in one place. Instead of checking multiple Azure cost areas separately, administrators can use this dashboard to review spending scope, watch budget progress, and identify which resources are driving costs.
This page is especially useful for hosted organizations that need regular visibility into Azure usage. It helps administrators review consumption by month, limit the view to selected resource groups or subscriptions, generate or download reports, and quickly open the Azure portal for the same hosted organization.

The Azure Dashboard page acts as a cost and consumption overview for Azure-related activity in the hosted organization. The data shown on the page is influenced by the scope selected at the top of the screen, which means administrators can narrow the dashboard to the exact month, resource groups, and subscriptions they want to analyze.
The page combines three main types of information:
This makes the dashboard useful both for quick daily review and for more formal monthly cost analysis.
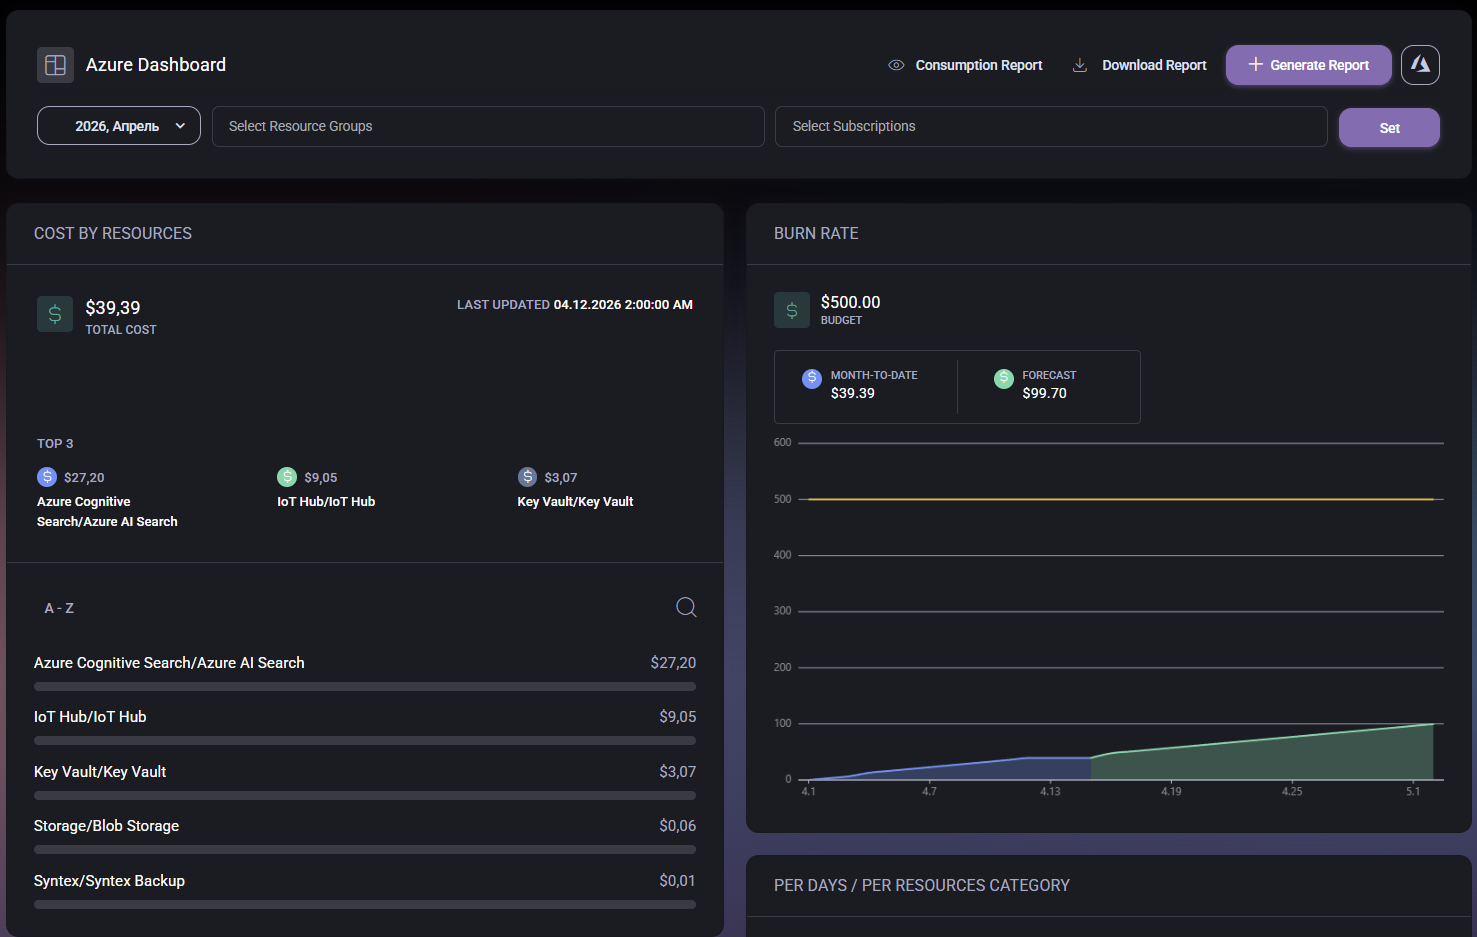
The top section of the page contains the main dashboard controls. These controls determine what data is shown and what report actions can be performed.
This toolbar is important because the charts and cost summaries below are only meaningful when the correct scope has been selected first.
The Cost by Resources widget shows how much the selected Azure scope has cost and which resources are contributing the most to that spend.
This widget is especially useful for identifying which Azure services or resources are responsible for most of the spend. In the example shown, services such as Azure Cognitive Search, IoT Hub, and Key Vault appear among the top resource costs.
The lower list extends that view by showing additional resources and their amounts, which helps administrators move beyond the top three and review the wider spending distribution.
The Burn Rate widget compares current spending against the configured budget and provides a forecast for the selected reporting period. This is one of the most useful parts of the page when the goal is to understand whether Azure costs are on track or moving toward a budget threshold.
This widget is helpful because it does not only show the current amount spent. It also helps administrators estimate whether the current trend is likely to remain under budget or move closer to the limit before the end of the month.
In practical terms, this section is useful for cost review meetings, budget monitoring, and early warning before Azure spend becomes unexpectedly high.
The Per Days / Per Resources Category chart shows spending distribution by day and by resource category. In the example shown, the chart uses stacked columns to represent how multiple cost categories contribute to daily totals across the reporting period.
This view is especially useful when administrators need to understand not only how much was spent, but also when the cost changes happened and how different categories contributed to those daily amounts.
Compared to the resource list, this chart gives a more time-based and category-based explanation of the spend pattern. That makes it valuable for spotting peaks, comparing daily cost behavior, and understanding whether a specific type of Azure usage is growing during the selected month.
The Azure icon in the top-right corner is important because it connects the summarized MSPControl dashboard to the full Azure management environment for the current hosted organization. This gives administrators a fast path from cost monitoring into native Azure administration without manually navigating to the correct hosted organization context.
That makes the dashboard more than just a reporting screen. It also works as a launch point for deeper investigation when administrators need to validate billing, inspect resources directly, or continue troubleshooting in Azure.
No credit card required for free, limited license.