
The Veeam Dashboard in MSPControl offers a calendar-based view of your Veeam backup activities and global statistics about your backup environment. It helps you quickly identify which backups succeeded, failed, or encountered warnings on any given day, providing an at-a-glance overview of backup health, license status, and resource availability.
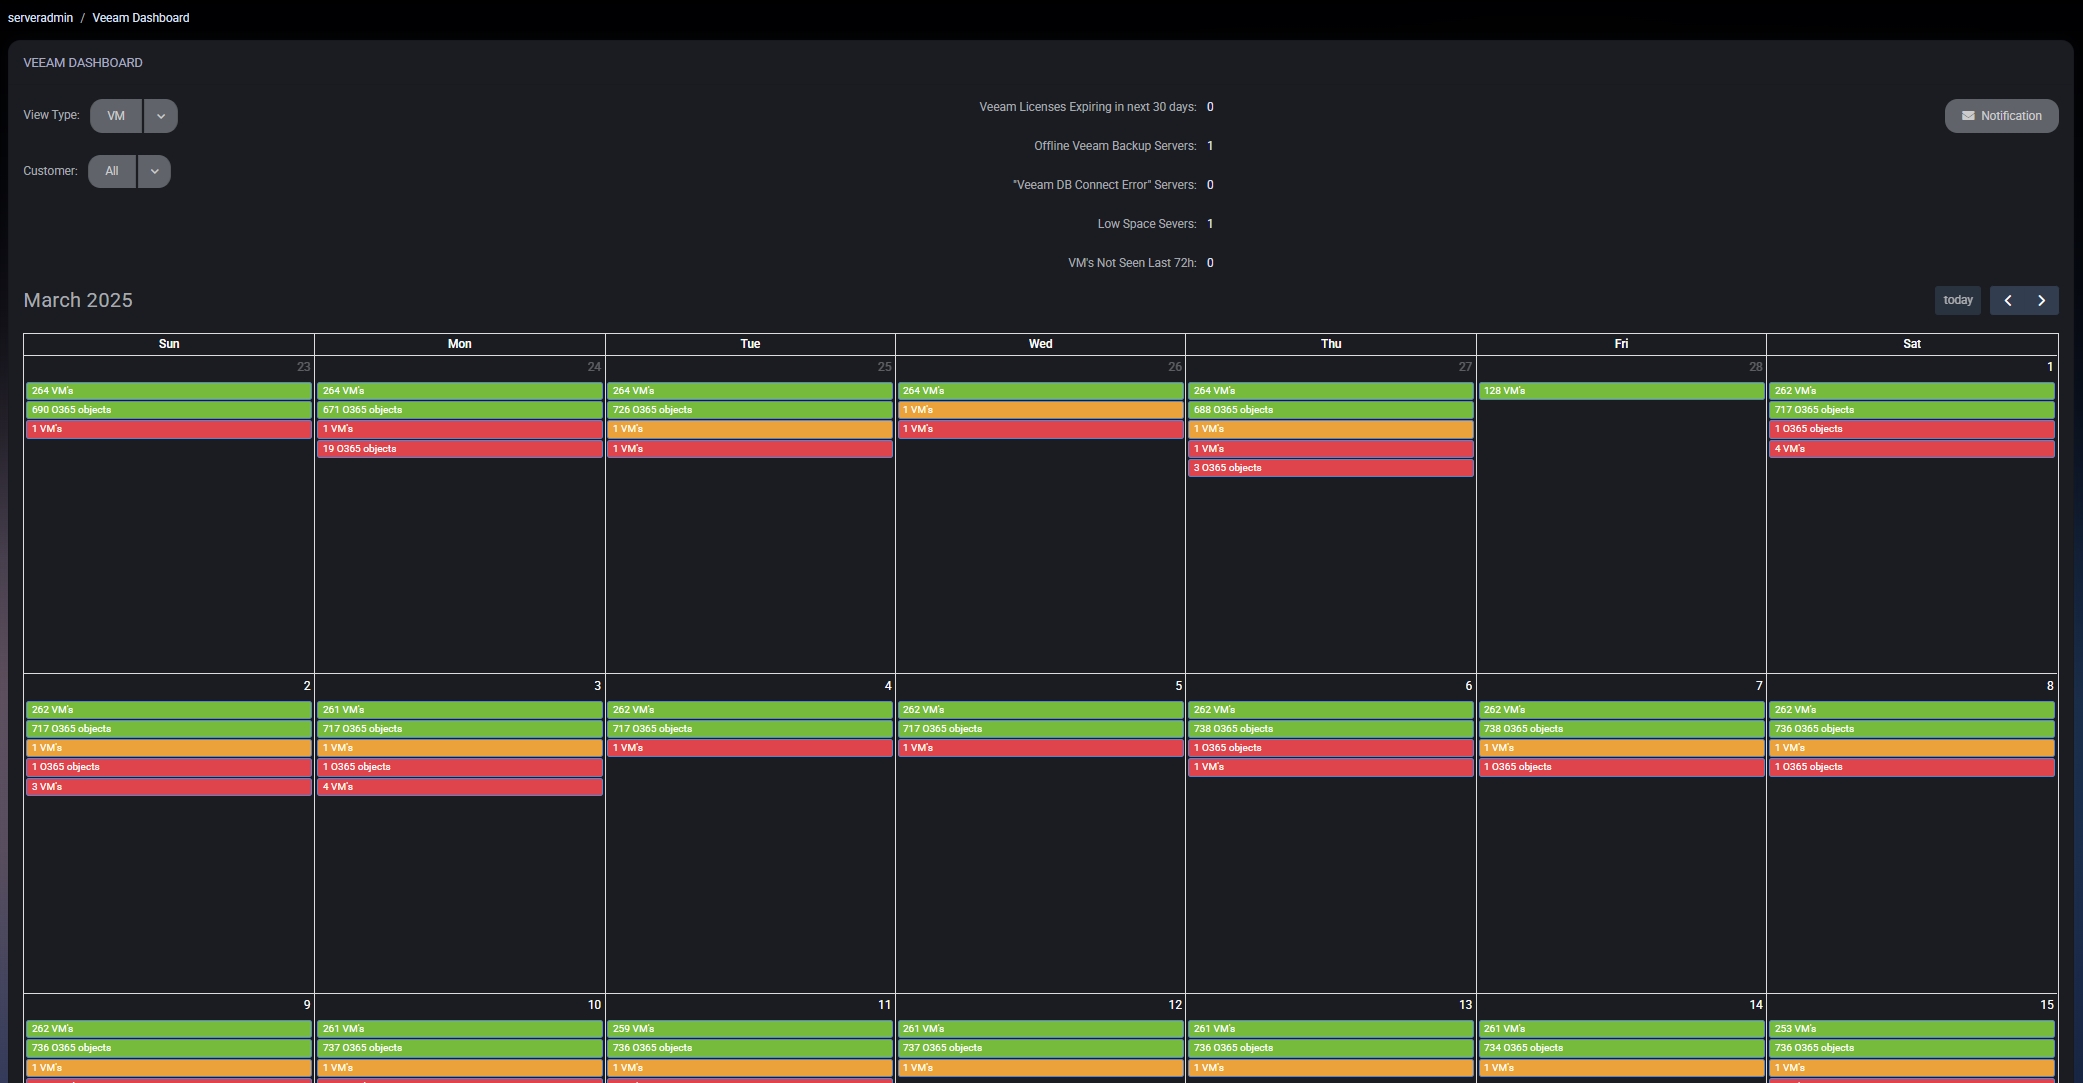
At the top of the dashboard, you may see quick metrics like:
These statistics provide a quick health check for your overall backup infrastructure, prompting you to address any urgent issues (e.g., renewing licenses, troubleshooting offline servers, or freeing up disk space).
Below the global stats, you’ll see a calendar for the current month (or selected month), where each day is color-coded to reflect the status of the backup jobs that ran:
This color-coding makes it easy to spot patterns, such as recurring failures on specific days or a job that frequently triggers warnings.
In the top-left corner, there’s a View Type selector allowing you to toggle between:
Choose the view that best suits your administrative needs. For instance, if you want to focus on specific backup jobs (e.g., “Daily Full Backup” vs. “Incremental”), switch to Job view. If you want to see how a particular VM is faring across multiple backups, pick VM view.
You can often filter by Customer (if you manage multiple clients) to narrow down the calendar to a single organization’s backups. Use the Next or Back buttons (or date pickers) to switch months and review historical or upcoming schedules.
Hovering over a colored entry on any day typically reveals more information, such as:
Clicking on a green, yellow, or red bar navigates you to a more detailed page that lists individual VMs, last restore points, warnings, or error messages for that specific backup job. This level of detail helps you diagnose issues quickly—if a job fails, you can investigate logs or configurations in Veeam to find the root cause.
You may see a Notification button or icon on the dashboard, allowing you to receive alerts if backups fail or reach a warning state. Configure these notifications according to your operational needs, ensuring you stay informed about critical backup events.
No credit card required for free, limited license.