Account Home
The Account Home page serves as the main dashboard for MSPControl users. It provides a complete overview of your organization, user profile, hosted resources, and quick access to essential management sections.
Account Header
At the top of the dashboard, you will see your profile block that summarizes account details:
- Company Name – the organization associated with your account.
- Full Name – your registered display name.
- Email – your contact email address.
- Role – defines your access level (for example, Customer).
- Status – indicates if your account is Active.
- Created / Updated – record creation and last update timestamps.
To the right of the header, you will find the gear icon (⚙) that opens additional account management options:
- View Account Summary – opens the User Account Summary window. From there, you can review your account’s welcome message and send the summary to a specific email address. This feature is useful for providing quick onboarding information to users.
- Edit Details – opens the User Account Details page where you can update personal information such as your name or email address.
- Change Password – allows you to securely change your login password.

Table of Contents — Widgets
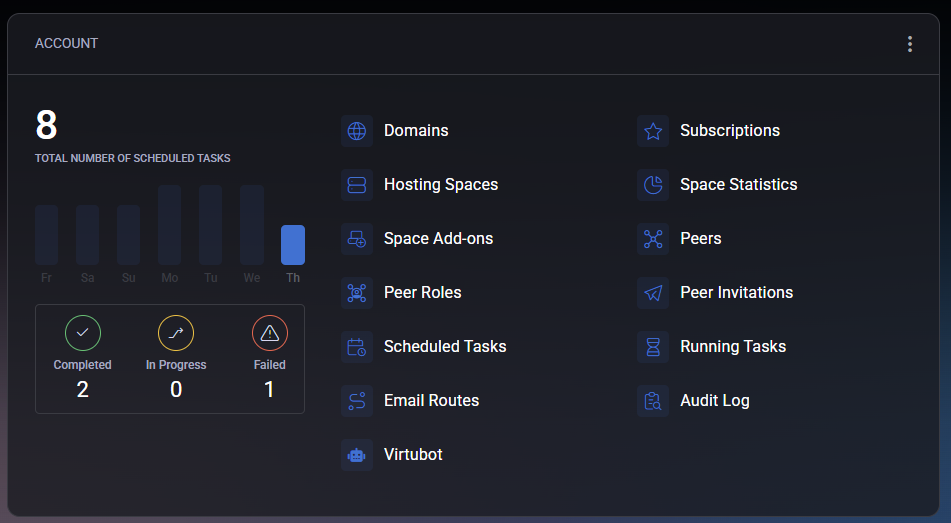
The Account widget provides a real-time overview of your scheduled tasks and quick links to essential service modules.
The upper section shows the Total Number of Scheduled Tasks for the last week, including task distribution by day and status indicators:
- Completed – successfully finished tasks.
- In Progress – tasks currently running.
- Failed – tasks that encountered errors.
The right side of the widget contains shortcut icons to the most frequently used areas:
- Domains – manage all registered domains.
- Hosting Spaces – view and modify hosting environments.
- Subscriptions – manage your current service plans.
- Space Statistics – monitor resource usage within your hosting spaces.
- Space Add-ons – manage optional service extensions.
- Peers and Peer Roles – configure delegated access to your account.
- Scheduled Tasks – view and configure background task automation.
- Email Routes – adjust mail routing and delivery settings.
- Virtubot – open the automation assistant.
- Audit Log – view activity records and system events.
The widget also includes a filter function (accessible from the three-dot menu). Using it, you can select which quick-access tiles are visible. This allows you to customize the dashboard layout to match your workflow. You can also remove the entire widget using Remove Widget from Dashboard.
Domains Widget
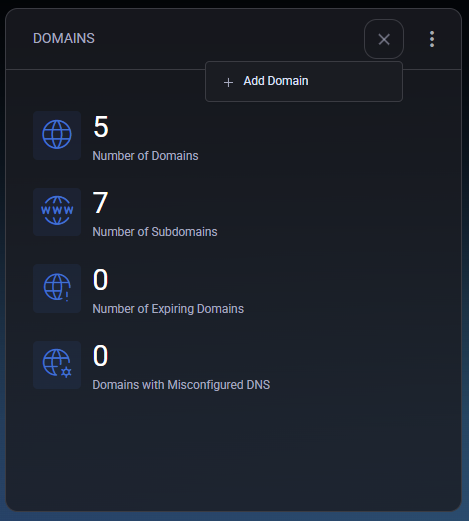
The Domains widget summarizes all domains linked to your account. It provides key statistics for domain and subdomain management:
- Number of Domains – total registered domains under your hosting spaces.
- Number of Subdomains – total subdomains created.
- Number of Expiring Domains – shows domains nearing expiration (if supported by your hosting provider).
- Domains with Misconfigured DNS – lists domains that may require DNS configuration corrections.
You can use the Add Domain button to register a new domain directly from this widget. Similar to the Account widget, the Domains widget includes a filter menu that lets you show or hide specific domain statistics or remove the widget entirely from the dashboard.
The Organizations widget provides a centralized overview of all hosted organizations and related services within your account. This widget is divided into multiple tabs, allowing users to navigate between sections such as Organization, Azure, Microsoft 365, Exchange Online, SharePoint Online, Microsoft Teams, Cloud Folders, RDS, Devices, Backups, and Security.
The widget cannot be filtered, but it can be removed from or re-added to the dashboard using the main widget menu.
Organizations Widget — Table of Contents
Organization Tab
The Organization tab is the default view displayed when you open the Organizations widget. It gives a quick summary of user statistics and provides shortcuts to essential organization management tools.
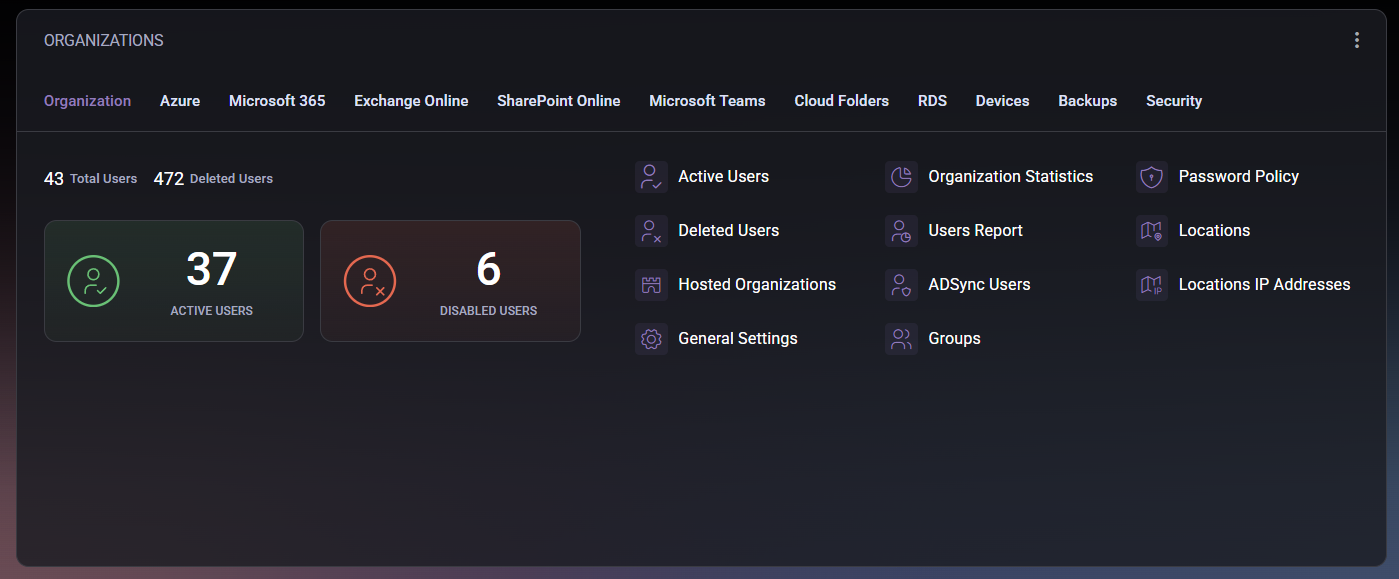
The top of the tab displays total user counts:
- Total Users – shows the total number of accounts registered in your organization.
- Deleted Users – shows how many accounts have been removed but remain recorded in system history.
Below, you can view active and disabled users represented as two large counters:
- Active Users – currently enabled and functioning user accounts.
- Disabled Users – accounts temporarily deactivated or suspended.
On the right side of the tab, additional management options are available:
- Active Users – open the list of all active accounts within your organization.
- Deleted Users – access accounts that have been deleted or archived.
- Hosted Organizations – view organizations hosted under your account, useful for MSPs managing multiple tenants.
- General Settings – access configuration options for your organization, such as display name or internal identifiers.
- Organization Statistics – view analytical data about organization usage and resource distribution.
- Users Report – generate a full report of user activity, status, and assigned roles.
- ADSync Users – displays users synchronized with Azure Active Directory.
- Groups – manage user groups and assign permissions or roles within the organization.
- Password Policy – open security settings that define password complexity and expiration rules.
- Locations – view and manage organization sites or offices registered in MSPControl.
- Locations IP Addresses – manage IP allocations assigned to each physical or logical location.
This tab is designed to help you quickly assess the overall health of your organization, view key statistics, and navigate directly to related user or policy management areas.
Azure Tab
The Azure tab provides an overview of your Microsoft Azure consumption, billing forecast, and configuration tools directly integrated with MSPControl. It is primarily used to monitor costs, manage Azure subscriptions, and configure Entra ID and security-related settings.
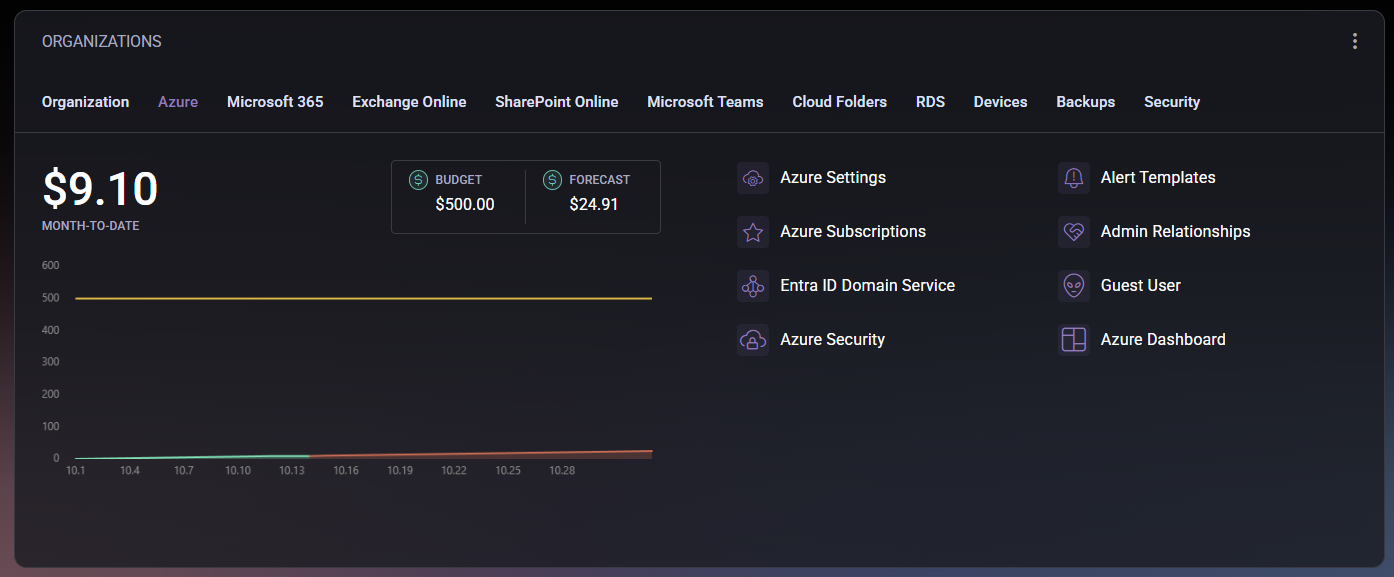
At the top of the tab, you will find key financial indicators:
- Month-to-Date – shows your current Azure spending for the ongoing month.
- Budget – displays the total budget limit defined for your Azure usage. Staying within this limit helps prevent unexpected charges.
- Forecast – provides an estimated cost projection based on your current consumption trend.
A cost chart below these values visualizes your Azure spending over time. It allows administrators to identify patterns or anomalies in resource usage.
On the right side, the tab provides shortcuts to Azure management tools available through MSPControl:
- Azure Settings – access configuration options related to Azure integration, API connections, and authentication settings.
- Azure Subscriptions – view and manage linked Azure subscriptions, including their current state, limits, and resource assignments.
- Entra ID Domain Service – manage Entra ID (formerly Azure Active Directory) domain synchronization and directory-based services.
- Azure Security – monitor and configure security compliance settings for Azure tenants.
- Alert Templates – customize notification templates related to Azure usage, thresholds, and incidents.
- Admin Relationships – review and manage delegated admin permissions between your MSP account and client tenants.
- Guest User – view or add guest users who have temporary or external access to Azure resources.
- Azure Dashboard – open a detailed Azure usage dashboard for in-depth monitoring and reporting.
This tab helps MSPs and IT administrators monitor cloud costs, maintain compliance, and ensure all Azure integrations are correctly configured for ongoing operations.
Microsoft 365 Tab
The Microsoft 365 tab provides visibility into your Microsoft 365 environment, including service subscriptions, storage utilization, group management, and overall service health. It helps administrators oversee licensing and monitor the operational status of Microsoft cloud services directly within MSPControl.
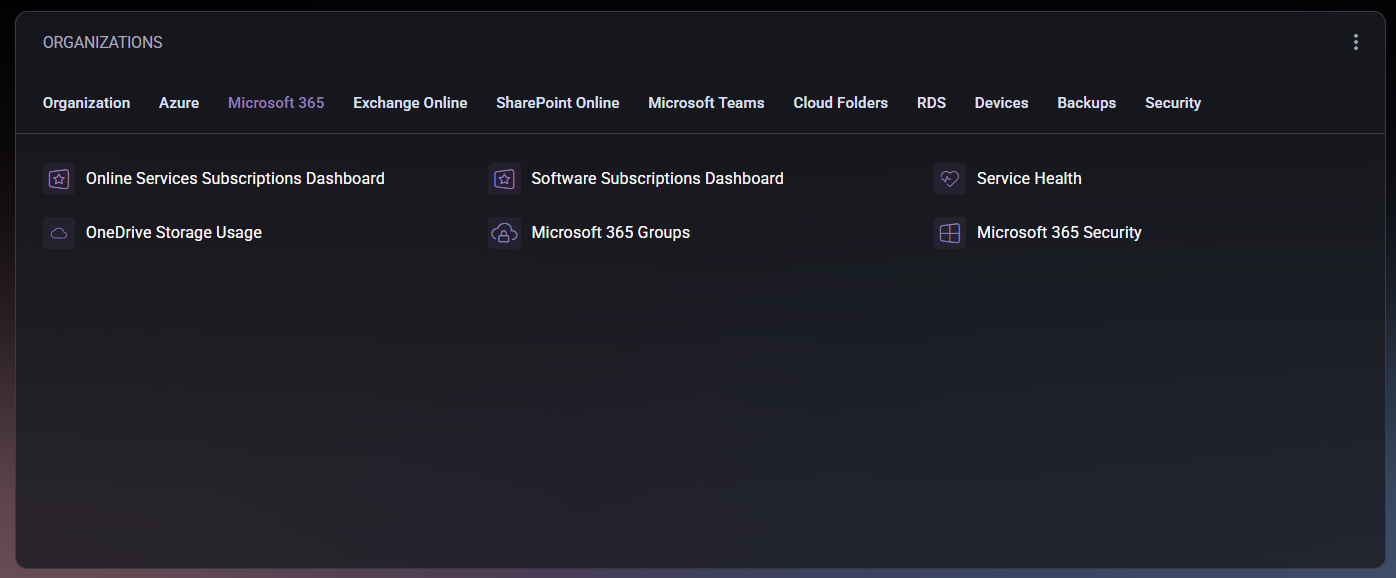
This tab contains several key shortcuts and dashboards:
- Online Services Subscriptions Dashboard – displays all active Microsoft 365 online service subscriptions, including assigned plans and their current usage. This dashboard allows administrators to monitor licensing allocation and identify unused or over-licensed accounts.
- Software Subscriptions Dashboard – provides an overview of software-based subscription licenses (such as Microsoft 365 Apps for Business or Enterprise). It helps track license availability and renewal status.
- Service Health – opens a status view showing the current operational state of Microsoft 365 services (Exchange Online, SharePoint, Teams, etc.). Administrators can use this section to verify whether service interruptions or maintenance events are affecting their tenants.
- OneDrive Storage Usage – presents detailed information about OneDrive usage across your users, including allocated versus used storage per account. This helps ensure that users remain within defined storage limits.
- Microsoft 365 Groups – allows management of Microsoft 365 Groups, including creation, membership adjustments, and synchronization with Azure Active Directory. Groups can be used to assign permissions and simplify collaboration structures.
- Microsoft 365 Security – provides a gateway to review and configure security recommendations, compliance alerts, and configuration baselines related to Microsoft 365 services.
Together, these dashboards offer a complete operational picture of your Microsoft 365 environment, helping ensure optimal license usage, data compliance, and service reliability.
Exchange Online Tab
The Exchange Online tab provides access to all email-related management areas for your Microsoft 365 tenant integrated through MSPControl. This section allows administrators to configure mailboxes, distribution groups, policies, and compliance settings without directly accessing the Microsoft 365 admin center.
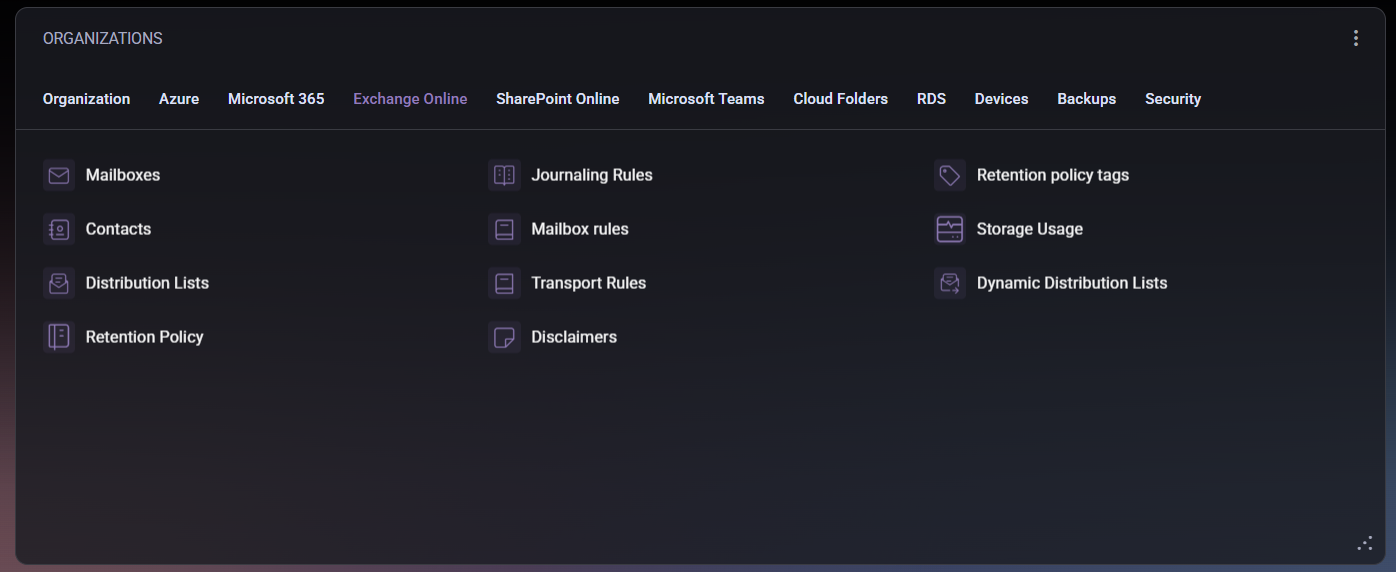
The tab is divided into several functional shortcuts:
- Mailboxes – displays a list of user and shared mailboxes available within your organization. From here, you can manage mailbox permissions, aliases, forwarding, and quotas.
- Contacts – manage external contacts stored within Exchange Online. These can be used for address book visibility or inclusion in distribution lists.
- Distribution Lists – configure traditional email distribution lists used to send messages to multiple recipients at once. You can create new lists, modify members, and set delivery restrictions.
- Retention Policy – defines how long emails and items are retained before being automatically archived or deleted. This section helps maintain compliance with organizational or regulatory requirements.
- Journaling Rules – set up journaling policies to record and archive copies of messages sent or received. Commonly used for compliance and auditing purposes.
- Mailbox Rules – manage server-side mailbox rules that apply to incoming and outgoing mail. Useful for automatically sorting or redirecting messages based on conditions.
- Transport Rules – configure organization-wide message flow rules to enforce policies, apply disclaimers, block certain content, or reroute messages.
- Disclaimers – create and manage email disclaimers or signatures applied to all outgoing messages from your organization.
- Retention Policy Tags – define specific retention periods or actions (delete, archive, move) applied to individual folders or message types.
- Storage Usage – provides an overview of mailbox storage utilization across all users, helping identify accounts nearing quota limits.
- Dynamic Distribution Lists – manage distribution groups that automatically include members based on predefined filters (e.g., department, location, or title) instead of manual assignment.
Through this tab, administrators can efficiently manage their Exchange Online environment, implement compliance standards, and maintain optimal mailbox performance without leaving the MSPControl interface.
SharePoint Online Tab
The SharePoint Online tab provides access to your organization’s SharePoint Online sites and storage management tools. It helps administrators monitor site collections, manage allocated storage, and quickly access connected OneDrive resources.
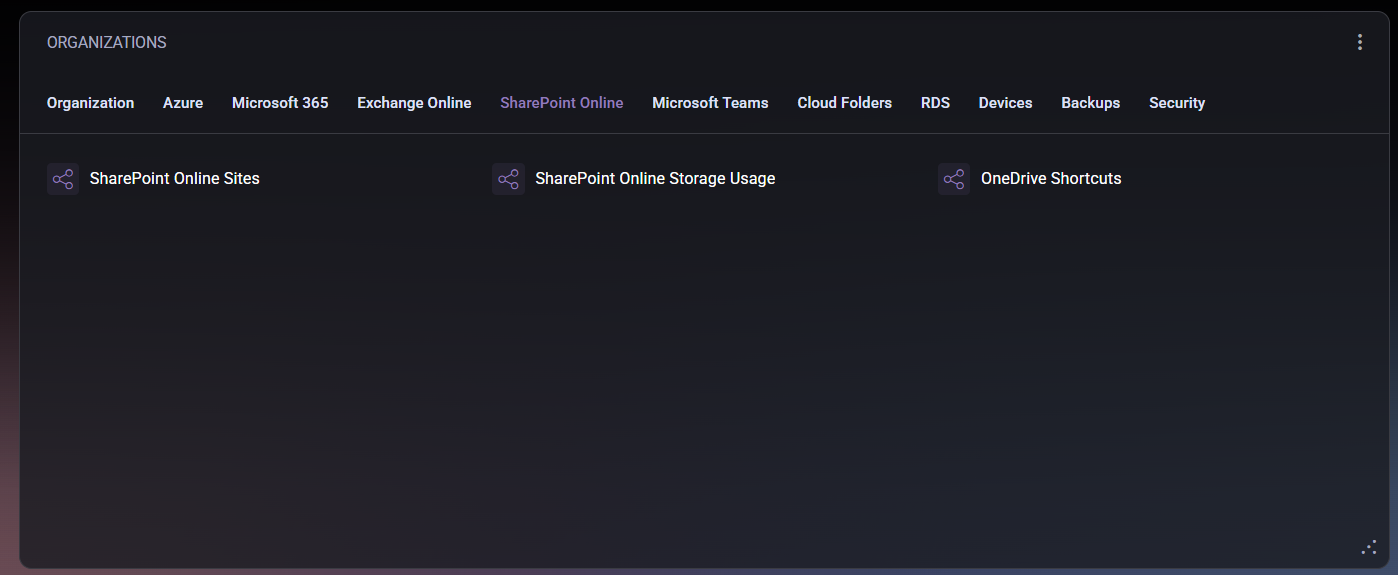
This tab includes the following options:
- SharePoint Online Sites – displays a list of all active SharePoint sites within your Microsoft 365 tenant. Administrators can use this section to view site details, access permissions, and verify connectivity. Each site can be opened directly from the panel for further management within the Microsoft 365 admin center.
- SharePoint Online Storage Usage – shows detailed information about storage utilization across all SharePoint sites. It includes total allocated space, used capacity, and remaining available storage. This helps prevent overuse and supports effective capacity planning.
- OneDrive Shortcuts – provides quick access to linked OneDrive locations for end users or administrators. This option enables efficient navigation between personal storage and organizational SharePoint resources.
This tab centralizes all SharePoint and OneDrive storage insights, ensuring that administrators can easily maintain performance, optimize storage distribution, and guarantee reliable access to shared content.
Microsoft Teams Tab
The Microsoft Teams tab provides an overview of user assignments and licensing plans associated with Microsoft Teams. It is designed to help administrators quickly verify who has access to Teams services and under which license type.
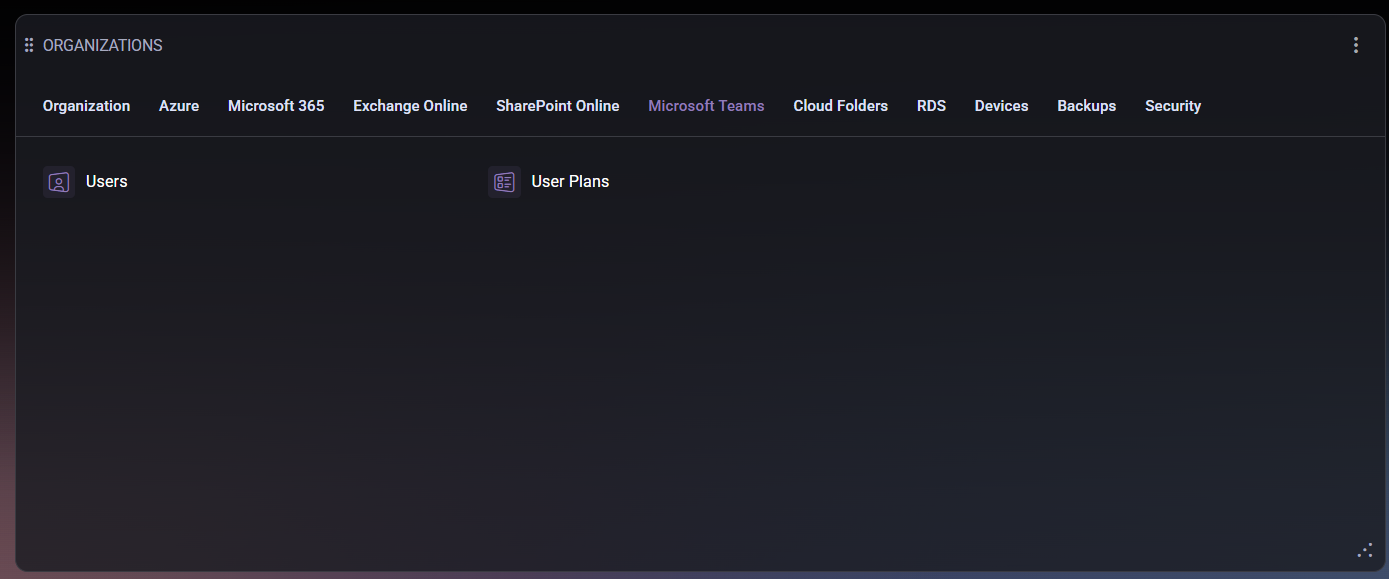
This tab includes two primary options:
- Users – displays a list of users who are currently enabled for Microsoft Teams within your organization. From this section, administrators can view user-specific details such as display name, assigned licenses, and activity status. This view helps confirm which users have active Teams permissions and ensures that all required users are provisioned correctly.
- User Plans – shows which service plans are assigned to each user, including Teams, Exchange, SharePoint, and other Microsoft 365 workloads. This allows administrators to identify users with partial or missing service plans, ensuring that collaboration features like chat, meetings, and file sharing are properly licensed.
Using this tab, administrators can maintain visibility into Teams licensing compliance, detect potential gaps in access rights, and manage service enablement across the organization without leaving the MSPControl interface.
Cloud Folders Tab
The Cloud Folders tab provides access to cloud-based file storage and synchronization tools available to your organization. It enables administrators and users to manage shared and personal folders, monitor synchronization status, and configure network drive mappings.
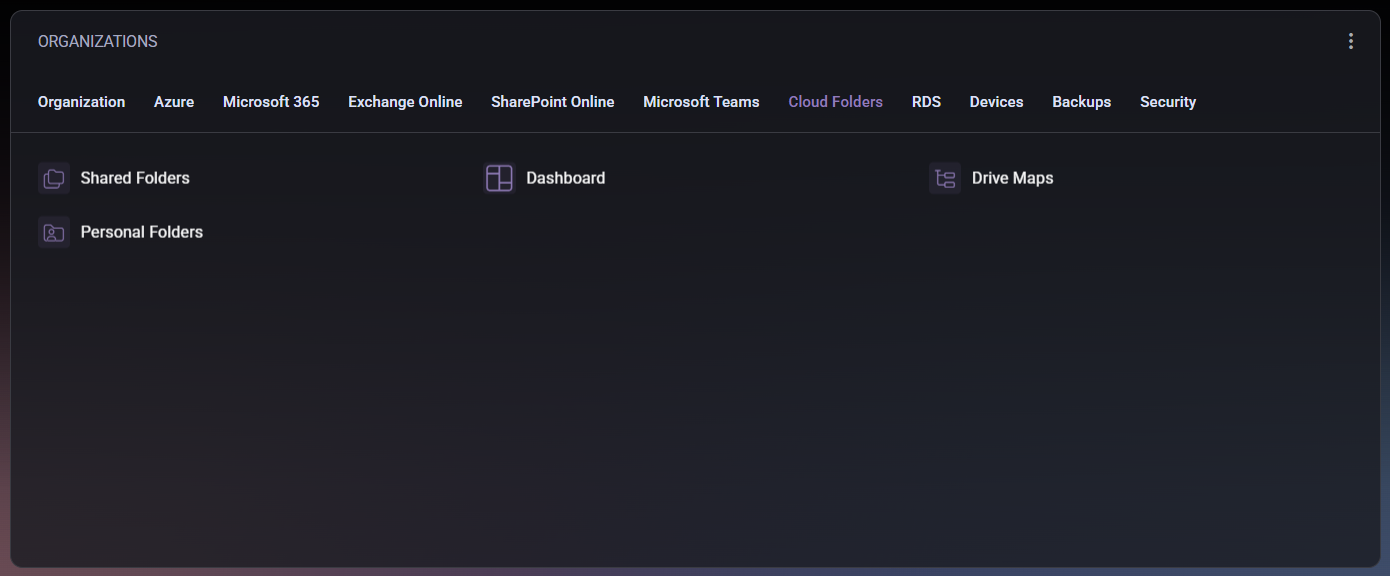
This tab includes the following sections:
- Shared Folders – displays shared cloud folders accessible by multiple users or departments. Administrators can review permissions, add or remove users, and verify synchronization status between on-premises and cloud storage.
- Personal Folders – shows personal storage locations for individual users. Each user’s private cloud folder can be managed here, ensuring secure access and correct quota allocation.
- Dashboard – provides an overview of all cloud folder activities, including usage metrics, synchronization health, and access statistics. This view helps administrators quickly identify issues or storage trends.
- Drive Maps – allows mapping of cloud storage locations to network drives for easier access from user devices. It provides centralized configuration of drive letters and connection parameters, helping standardize the user experience across the organization.
Through this tab, both administrators and users can maintain visibility and control over shared file resources while ensuring consistent integration between cloud storage and local infrastructure.
RDS Tab
The RDS (Remote Desktop Services) tab provides a centralized view for managing and monitoring remote desktop environments available within your organization. It allows administrators to view RDS collections, monitor resource allocation, and verify user access to virtualized desktops and applications.
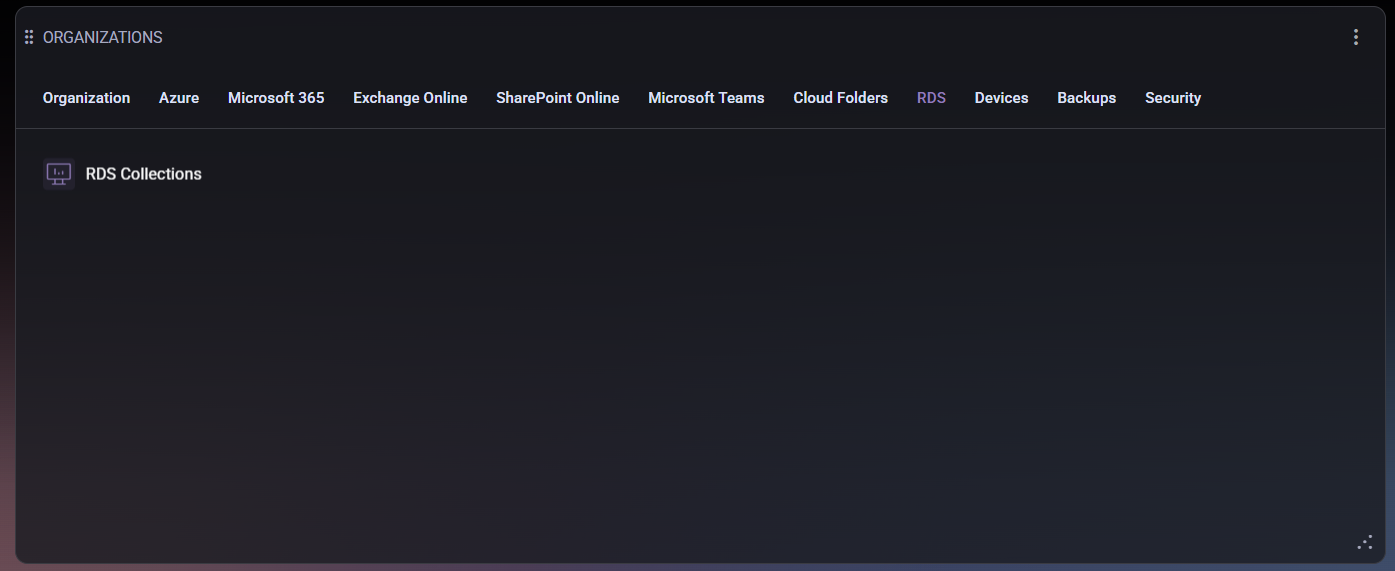
This tab includes the following section:
- RDS Collections – displays all active Remote Desktop collections configured in the environment. Each collection typically contains one or more session hosts and can be used to publish desktops or specific applications to users. Administrators can review the current configuration, check connection health, and ensure that the RDS deployment is properly synchronized with the hosting environment.
The RDS interface simplifies access management for virtual desktop infrastructure (VDI) environments, enabling administrators to maintain user productivity and securely deliver remote applications directly through the MSPControl portal.
Devices Tab
The Devices tab provides a complete overview of all managed devices within the organization. It helps administrators monitor workstation and server health, verify agent status, and ensure that all systems comply with defined update and security standards.
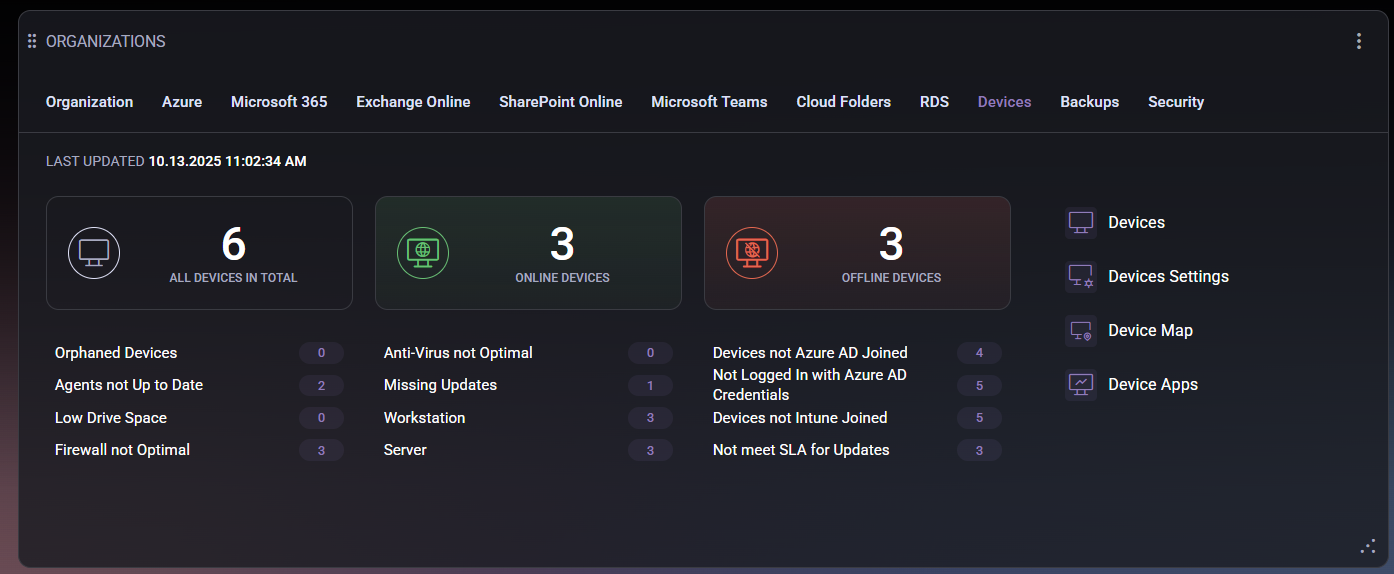
The top section of the tab displays real-time device statistics:
- All Devices in Total – the total number of devices managed by MSPControl.
- Online Devices – devices currently active and connected to the management platform.
- Offline Devices – devices that are currently unreachable or have been disconnected from the network.
Below these counters, MSPControl highlights system health indicators such as outdated agents, low disk space, missing antivirus, or firewall misconfigurations. These alerts allow administrators to quickly identify and prioritize systems requiring attention. Device category tags (e.g., Workstation, Server) also help distinguish between types of endpoints.
The right-hand section provides access to management modules:
- Devices – displays the full inventory of managed endpoints, including device names, roles, and current connection status.
- Device Settings – contains configuration parameters for device monitoring, update frequency, and communication policies.
- Device Map – visualizes device distribution and network topology, helping identify connectivity and location-based issues.
- Device Apps – lists installed applications across managed devices, allowing administrators to track software deployment and compliance.
By combining device statistics, alert conditions, and management shortcuts, the Devices tab acts as a centralized control center for endpoint health and compliance monitoring.
Backups Tab
The Backups tab provides an overview of backup solutions integrated within your organization. It focuses primarily on cloud-based backups to ensure business continuity, data protection, and disaster recovery readiness.
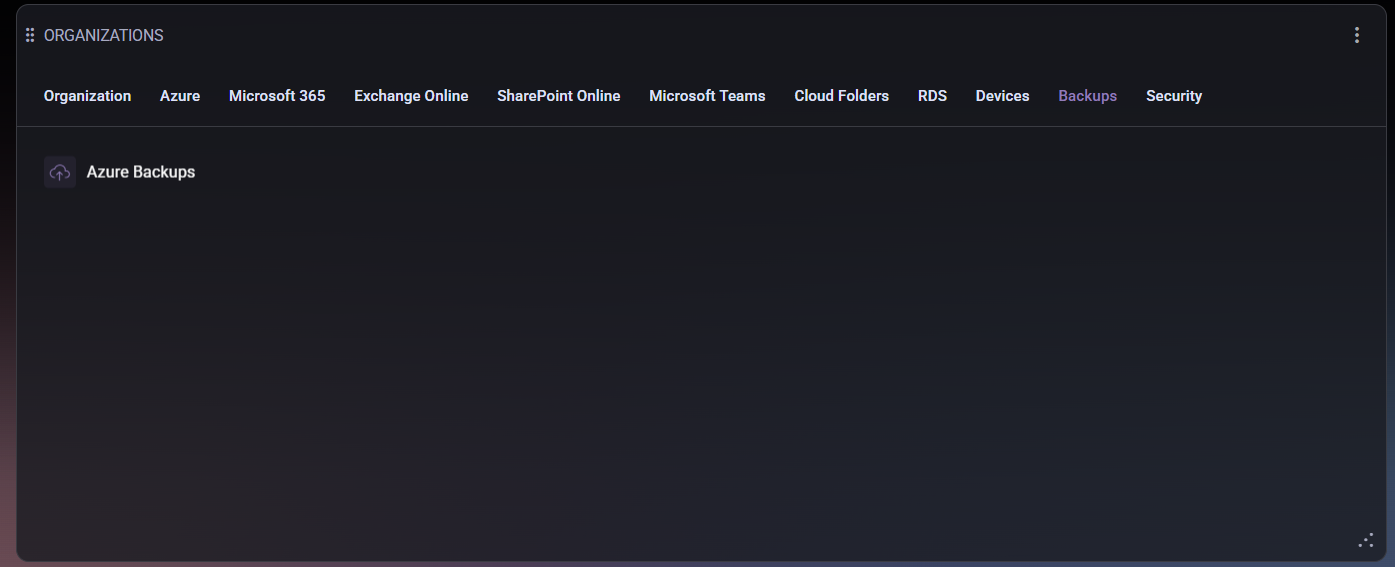
This tab includes the following section:
- Azure Backups – displays all configured backup jobs running in Microsoft Azure. Administrators can monitor backup status, retention policies, and recent activity logs to ensure that data recovery points are successfully created and maintained. This section helps confirm that all critical workloads — such as virtual machines, databases, or file shares — are properly protected and meet the organization’s recovery objectives.
Using the Backups tab, administrators can quickly verify the integrity of their backup infrastructure, track potential failures, and confirm that all scheduled backup processes are executed as planned. This ensures compliance with internal data protection standards and external regulatory requirements.
Security Tab
The Security tab provides a unified overview of your organization’s current security posture, helping administrators monitor and improve identity protection, compliance, and incident management across Microsoft 365 and Azure environments.
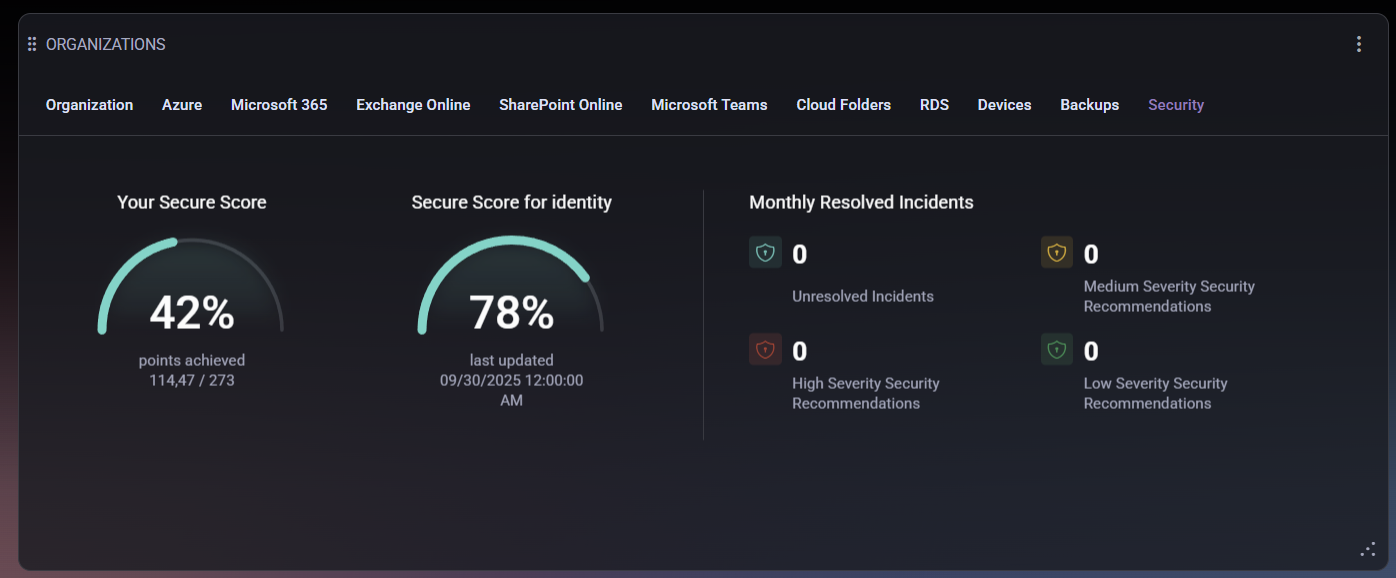
The tab displays several key metrics and insights:
- Your Secure Score – a global security rating based on implemented best practices and security configurations across all managed services. It reflects how well the organization’s settings align with Microsoft’s security recommendations.
- Secure Score for Identity – a dedicated rating that evaluates user identity protection, including multi-factor authentication (MFA) usage, conditional access policies, and account hygiene. The score helps administrators identify vulnerabilities related to user authentication and access control.
- Monthly Resolved Incidents – summarizes recent security-related events and categorizes them by severity:
- Unresolved Incidents – open security alerts requiring review or remediation.
- High Severity Security Recommendations – critical actions suggested to address significant vulnerabilities.
- Medium Severity Security Recommendations – issues of moderate importance that may impact compliance or protection levels if left unaddressed.
- Low Severity Security Recommendations – minor configuration improvements or non-critical recommendations to enhance overall security.
The Security tab is essential for maintaining proactive defense within your environment. It enables administrators to identify weak points, track security progress, and ensure the organization meets compliance and risk management standards.
The Smile Back CSAT Score widget provides insights into customer satisfaction levels based on feedback collected through surveys. It helps organizations measure service quality, response effectiveness, and overall user sentiment toward support performance.
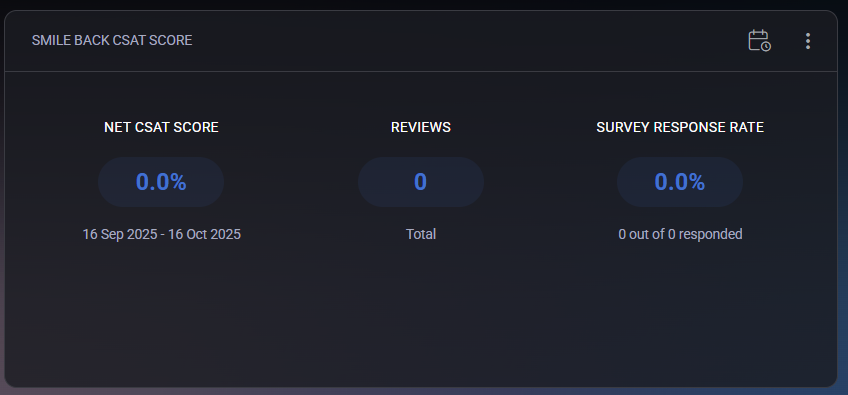
The widget includes three primary metrics:
- Net CSAT Score – represents the overall customer satisfaction percentage during the selected period. The score is calculated from all received survey responses, showing how many users rated their experience positively versus negatively.
- Reviews – displays the total number of received feedback submissions within the defined reporting period.
- Survey Response Rate – indicates the percentage of users who responded to the surveys out of all invited participants. A higher rate reflects stronger user engagement.
Administrators can select a custom reporting period using the calendar icon in the upper-right corner. After choosing From and To dates, clicking Generate Report updates the displayed data for the specified range.
The widget also supports display customization through filters:
- Show Net CSAT Score – toggles visibility of the overall satisfaction metric.
- Show Reviews – enables or hides the total number of survey responses.
- Show Survey Response Rate – controls the visibility of the response rate indicator.
- Remove Widget from Dashboard – removes the widget entirely from the current dashboard view.
The Smile Back CSAT Score widget provides a concise and visual overview of user feedback performance, helping organizations continuously improve service quality and client satisfaction.
The Hosting Spaces widget provides a quick overview of the hosting environments available to the customer. Each hosting space represents a separate service container that holds related resources such as domains, mail accounts, websites, and databases associated with a specific organization or subscription.
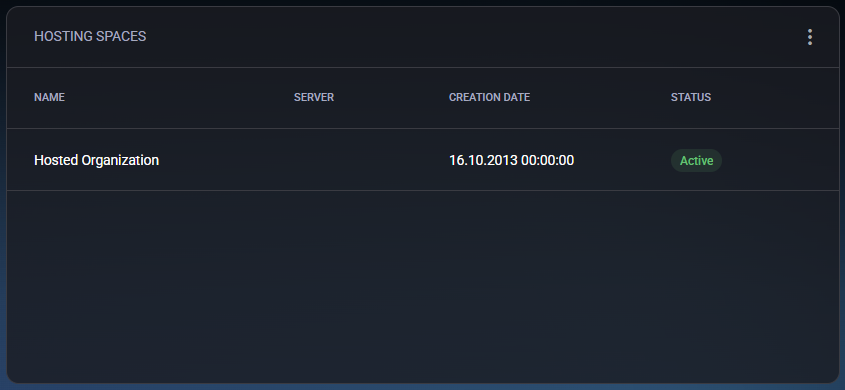
The widget displays the following information:
- Name – the name of the hosting space. Typically, it corresponds to the organization or tenant name (for example, Hosted Organization).
- Server – identifies the physical or virtual server where this hosting space is deployed.
- Creation Date – shows when the hosting space was originally created.
- Status – indicates the current operational state of the hosting space. For example, Active means the environment is fully functional and accessible.
The Hosting Spaces section helps users and administrators verify that their organization’s hosting environment is available and properly configured. It also provides a starting point for navigating deeper into hosted services, such as web hosting, mail management, or resource allocation.
The Microsoft Admin Portals widget provides quick access links to the most essential Microsoft administration centers, allowing administrators to manage services, licenses, security, and compliance across their Microsoft 365 and Azure environments.
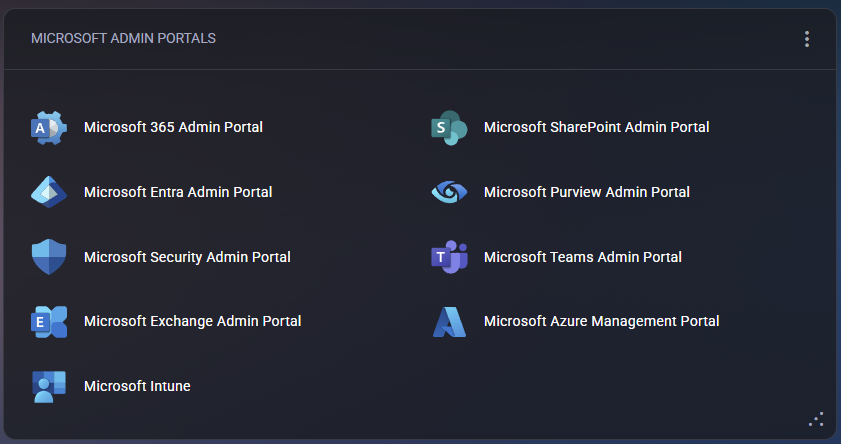
This widget acts as a unified gateway for managing multiple Microsoft platforms from a single panel. Each portal link opens in a new browser tab, providing direct access to specific administrative functions.
The available portals include:
- Microsoft 365 Admin Portal – manage users, licenses, and organization-wide settings for Microsoft 365.
- Microsoft Entra Admin Portal – configure identity management, conditional access, and Azure AD policies.
- Microsoft Security Admin Portal – monitor and configure security alerts, threat protection, and compliance policies.
- Microsoft Exchange Admin Portal – administer mailboxes, transport rules, and Exchange-related configurations.
- Microsoft Intune – manage devices, applications, and endpoint compliance.
- Microsoft SharePoint Admin Portal – configure SharePoint sites, permissions, and storage usage.
- Microsoft Purview Admin Portal – manage compliance, data loss prevention (DLP), and information governance.
- Microsoft Teams Admin Portal – manage Teams policies, users, and meeting configurations.
- Microsoft Azure Management Portal – control Azure subscriptions, resources, budgets, and role assignments.
The Microsoft Admin Portals widget centralizes access to all major Microsoft service dashboards, improving administrator productivity and simplifying cross-platform management.
The Documentation widget serves as a centralized repository for storing and managing important organizational data such as credentials, certificates, asset details, and other documentation. It helps customers and administrators maintain essential records in a structured, secure, and easily accessible way.
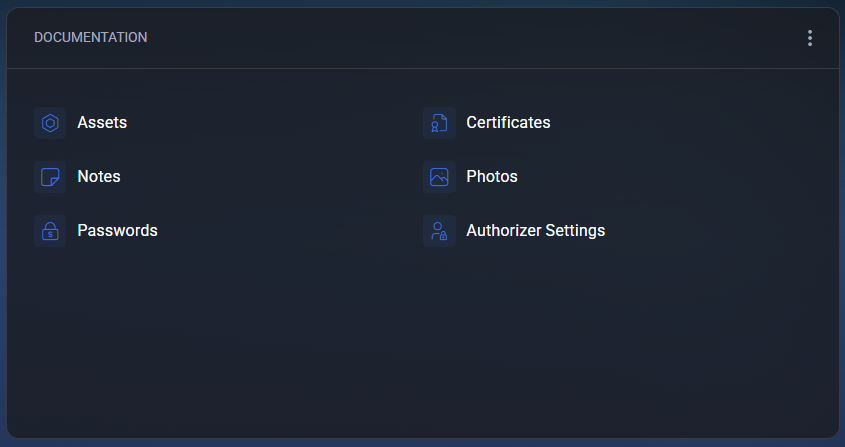
The widget includes several categories:
- Assets – used to document and track hardware or software resources, such as servers, licenses, and critical infrastructure components.
- Certificates – stores and manages SSL/TLS and other types of certificates, helping ensure encryption compliance and timely renewal management.
- Notes – allows saving important text-based information, such as configuration details, troubleshooting steps, or service instructions.
- Photos – used for storing image-based documentation, for example, hardware rack layouts, wiring diagrams, or physical installation references.
- Passwords – provides a secure place to store and access service credentials or system login details, accessible only to authorized users.
- Authorizer Settings – allows configuration of access and authorization parameters for specific documentation or users.
The widget supports customization through filters accessible via the top-right menu:
- Show Assets – toggles the visibility of the Assets section.
- Show Certificates – enables or hides certificate-related records.
- Show Notes – displays or hides text documentation.
- Show Photos – toggles the visibility of image files.
- Show Passwords – shows or hides stored credentials.
- Remove Widget from Dashboard – permanently removes the widget from the current dashboard view.
The Documentation widget is designed to simplify recordkeeping by consolidating all critical information into one secure, well-organized location within the MSPControl customer portal.
The Mail widget provides a summary of the customer’s mail services usage and offers quick access to key management areas related to mailboxes, aliases, groups, and domains. It helps administrators monitor current usage and quickly navigate to specific sections for configuration or troubleshooting.
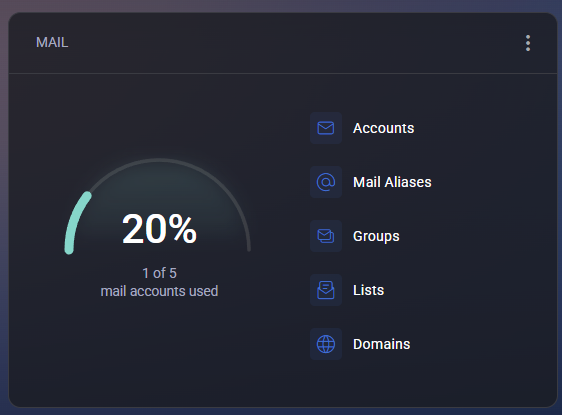
The main dashboard element shows overall mailbox utilization, indicating how many accounts are currently in use out of the total allowed quota. This visual progress indicator provides a quick understanding of mail capacity consumption.
The widget includes the following management sections:
- Accounts – view and manage user mailboxes, including mailbox creation, deletion, and configuration of size limits or forwarding rules.
- Mail Aliases – manage alternate email addresses that redirect messages to primary mailboxes.
- Groups – configure distribution groups for shared communication between multiple recipients.
- Lists – manage mailing lists used for automated message delivery to large recipient groups.
- Domains – view and configure domain names used for email services, including DNS-related settings.
Filter options allow customizing the widget display according to user preferences:
- Show Accounts – toggle visibility of the Accounts section.
- Show Mail Aliases – enable or hide alias-related data.
- Show Groups – show or hide group management links.
- Show Lists – toggle display of mailing lists.
- Show Domains – show or hide domain management links.
- Remove Widget from Dashboard – removes the Mail widget from the current dashboard layout.
The Mail widget is designed to offer a compact yet powerful overview of all mail-related resources, simplifying daily administration and ensuring quick access to the most relevant email service functions.
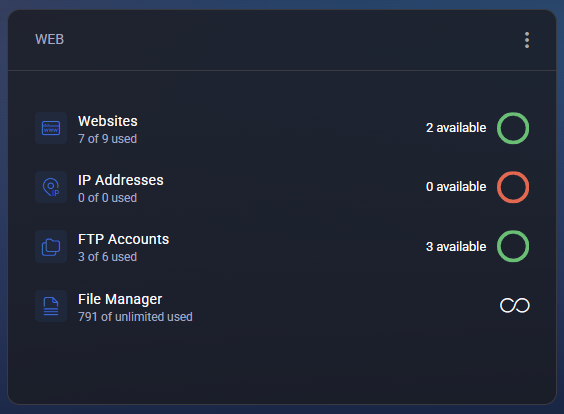
The Web widget provides a detailed overview of the customer’s web hosting resources and their current usage. It displays website, FTP, and IP address utilization, along with direct access to file management and hosting-related configuration tools.
This widget allows users and administrators to quickly assess available hosting capacity, check resource status indicators, and access the corresponding management sections.
The widget includes the following categories:
- Websites – shows the number of hosted websites currently used versus the total available. The “available” indicator reflects remaining website slots.
- IP Addresses – displays how many IP addresses are assigned and how many remain available. A red indicator signifies no free addresses left.
- FTP Accounts – provides a quick summary of created FTP accounts out of the total limit and a link to manage user access or credentials.
- File Manager – shows the number of stored files and offers access to the integrated file management interface for uploading, editing, and organizing website content.
Each resource is accompanied by a visual indicator:
- 🟢 Green circle – available capacity.
- 🔴 Red circle – capacity reached or exceeded.
- ∞ Infinity symbol – no limit set for the corresponding resource.
The widget supports flexible customization through filters:
- Show Websites – toggles visibility of website statistics and management access.
- Show IP Addresses – enables or hides IP address information.
- Show FTP Accounts – shows or hides FTP account data.
- Show File Manager – toggles display of file storage usage and quick access link.
- Remove Widget from Dashboard – removes the Web widget from the current dashboard view.
The Web widget provides a concise, visual summary of hosting resource utilization and direct navigation to core management tools, enabling quick status checks and efficient website administration.
The Databases widget provides a visual overview of the database resources allocated to the customer’s hosting space. It displays current utilization and offers quick access to database management tools for supported database types such as MySQL and MySQL 8.x.
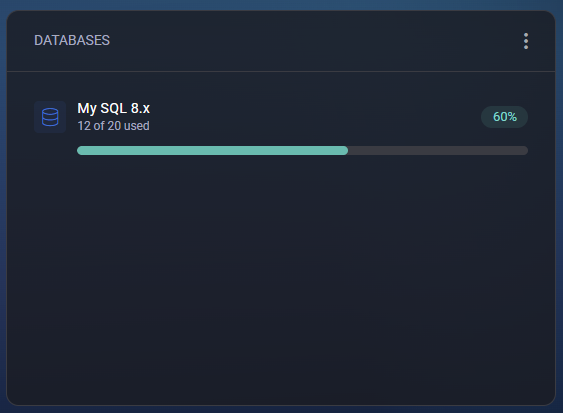
This widget helps administrators and users monitor how many databases are in use and how many are still available within their plan limits. The horizontal progress bar clearly indicates the percentage of consumption for each supported database type.
Displayed information includes:
- Database Type – shows the database engine in use (for example, MySQL 8.x or MySQL 5.x).
- Usage Indicator – displays the number of databases currently used versus the total quota (e.g., 12 of 20 used).
- Progress Bar – visualizes resource utilization percentage for quick assessment.
- Usage Percentage Badge – numeric value showing the exact percentage of used capacity (e.g., 60%).
The widget also includes configuration filters available from the context menu:
- Show MySQL 8.x – toggles visibility of the MySQL 8.x usage section.
- Remove Widget from Dashboard – removes the Databases widget from the current dashboard view.
If multiple database engines are supported (e.g., MySQL 5.x and MySQL 8.x), each engine appears as a separate item with its own progress indicator, allowing users to monitor usage per engine type independently.
The Databases widget provides a clear, compact summary of all database allocations and usage, helping ensure optimal resource planning and easy access to database administration tools.
