
The Disk Space Dashboard provides a high-level view of total disk space usage across your MSPControl deployment. It displays a single System hosting space, representing all allocated and used resources in the environment.
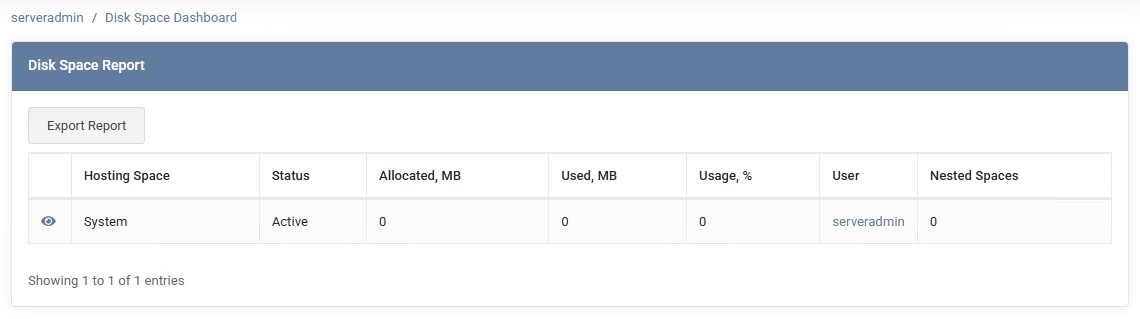
When you navigate to Dashboards > Disk Space Dashboard, you’ll see
one row labeled System, with details such as:
At the top, there’s an Export Report button, which generates an .htm
file containing the disk usage data. You can save or print this for recordkeeping, audits,
or capacity planning.
Next to the System entry, you’ll find an “eye” icon (View Details). Clicking it opens a window that breaks down disk usage by resource category, for example:
The specific list may vary depending on which services are enabled in your environment. This breakdown helps you see at a glance where disk usage is concentrated. For even more detail, clicking the System link in the table navigates to Account > Space Statistics, showing each resource in greater depth.
.htm export lets you retain a snapshot of usage for audits, budgeting, or capacity planning.No credit card required for free, limited license.