
The Bandwidth Dashboard provides a global view of data transfer usage in MSPControl. You can filter by date range (e.g., daily, monthly) to see how much bandwidth has been consumed and identify trends. There’s also an option to export the results for further analysis.
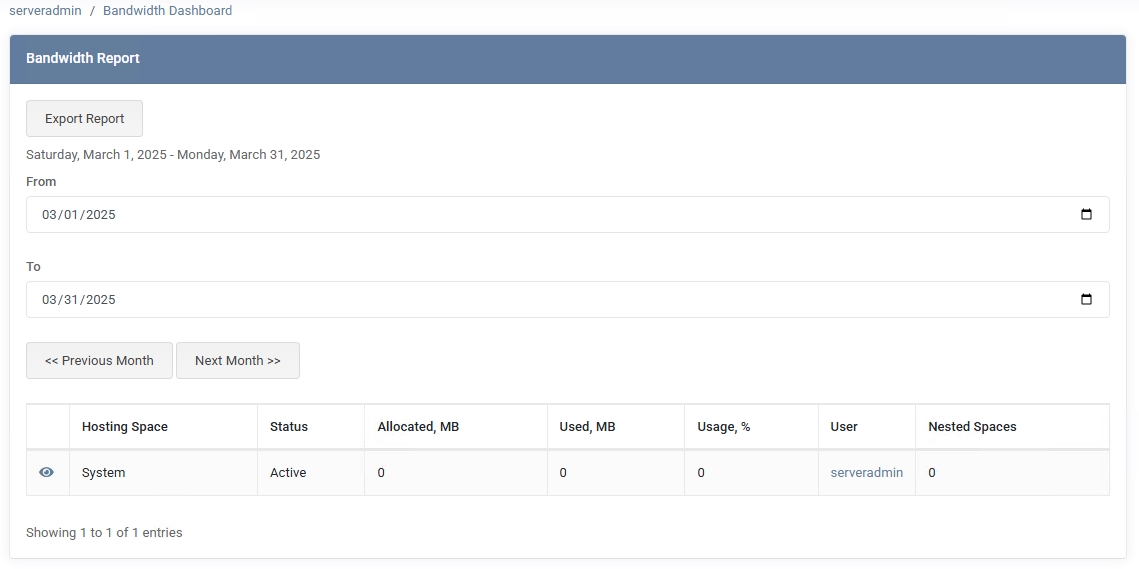
When you navigate to Dashboards > Bandwidth Dashboard, you’ll see a form to select a From and To date. Once you pick your desired date range, click Apply (or use the < Previous Month / Next Month > buttons) to refresh the report. The resulting table shows:
An Export Report button at the top generates an .htm file with the bandwidth usage details. You can save or print this file for recordkeeping, audits, or capacity planning.
Clicking the “eye” icon (View Details) next to the System row opens a modal showing a breakdown of bandwidth usage by resource category (e.g., Web, FTP, Mail), along with the amount of Sent and Received traffic. This allows you to see precisely where bandwidth is being consumed within the selected date range, helping you pinpoint trends or potential areas for optimization.
The specific list may vary depending on which services are enabled in your environment. This breakdown helps you see at a glance where disk usage is concentrated. For even more detail, clicking the System link in the table navigates to Account > Space Statistics, showing each resource in greater depth.
.htm export feature to capture a snapshot of bandwidth consumption for audits, billing reviews, or performance assessments.No credit card required for free, limited license.