Audit Log
The Customer Audit Log page provides a time-ordered record of actions that affect your account in MSPControl. It helps you verify what was done, when it happened, and which automated task or user initiated the change, maintaining security and compliance standards.
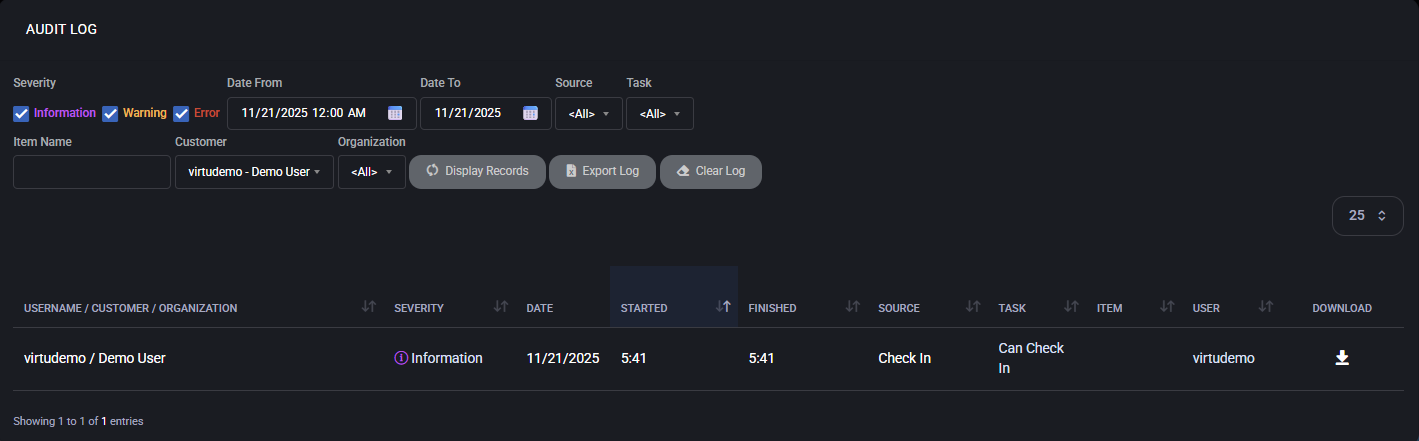
Table of Contents
Accessing the Customer Audit Log
The Customer Audit Log is available from the customer portal and shows only events related to:
- Your own customer account
- Your peers (other users who were granted access via Peers)
- Your organizations / hosting spaces
You cannot see activities for other customers; all data is scoped to your tenancy.
Filters and search options
Use the filters at the top of the page to narrow down which events are displayed in the log.
- Severity – Three checkboxes let you include or exclude:
- Information – Normal events, confirmations, and successful operations.
- Warning – Events that completed with non-critical issues or require attention.
- Error – Failed operations or tasks that did not complete successfully.
- Date From / Date To – Defines the time range of events to display.
Use this when you are investigating an issue that happened on a specific day or during a known period.
- Source – Shows where the event originated (for example, a scheduled task, a device-related process, or another service component).
Selecting a specific source helps you focus on events generated by that component only.
- Task – Name of the operation that generated the entry, such as:
Send E-Mail Notification, Devices Report, WordPress State Report, Zip Space Files, or user-initiated actions like Check In.
Choose a task to see only entries produced by that operation.
- Item Name – Optional text filter that searches for a specific object referenced in the log (for example, a website name, device, or user).
- Customer – Pre-filtered to your own customer account.
If your login has access to multiple customer records, use this list to switch between them.
- Organization – Limits results to a particular organization or hosting space under your account, or <All> to show everything you are allowed to see.
Page commands
After you configure the filters, use the command buttons to work with the log.
- Display Records – Runs the search with the selected filters and updates the list of events.
- Export Log – Exports the currently filtered set of audit entries to a file (for example, for offline analysis or attachment to a support ticket).
- Clear Log – Permanently clears the audit entries that belong to your customer scope.
Use this only if you intentionally want to remove historical records.
Log columns and details
Each row in the table represents a single event. The columns provide the following information:
- Username / Customer / Organization – Shows which user initiated the action (or for whom it ran), the related customer account, and the organization or hosting space affected.
- Severity – Information, Warning, or Error, as described above.
This helps you quickly spot failed or risky operations.
- Date – Calendar date of the event.
- Started – Exact time when the operation began.
- Finished – Time when the operation ended.
Comparing Started and Finished can help estimate how long a particular task took.
- Source – Component that generated the log entry (for example, a scheduled task framework or a service module).
- Task – Friendly name of the action that was executed, such as Send Mailboxes Space Report or Zip Space Files.
- Item – Context object for the action (for example, a device, website, mailbox, or report target).
- User – Portal user or peer on whose behalf the task was executed.
- Download – If available, provides a downloadable artifact generated by the task (for example, a PDF report or log file).
Click the icon to download the file to your workstation.
Typical usage scenarios
- Verify scheduled reports and notifications – Confirm that Tasks like Devices Report or Send Organization Users Report ran successfully, and download the resulting files if needed.
- Investigate issues – When users report a problem (for example, a missing report or failed device operation), filter the log by Severity Error and by the relevant Task to see what went wrong.
- Security and compliance review – Track which peers performed sensitive actions in your organizations and when those operations took place.
- Performance and timing analysis – Review Started and Finished timestamps to understand how long tasks such as zipping space files or generating reports usually take.
